Introduction
Counting a few wells by hand is manageable. Add several treatment groups and replicates, and you can spend much of the week at the microscope laboring over which colonies to include or exclude, keeping track of those you’ve already counted, and recording the data manually. Automated the process not only massively speeds up the process but also improves consistency and generates a permanent digital data record.
For laboratories running clonogenic assays or working with 3D spheroid cultures, GelCount™ combines imaging, counting and size analysis in one system. You get a digital record of your samples alongside the numbers.
Why manual counting becomes a bottleneck
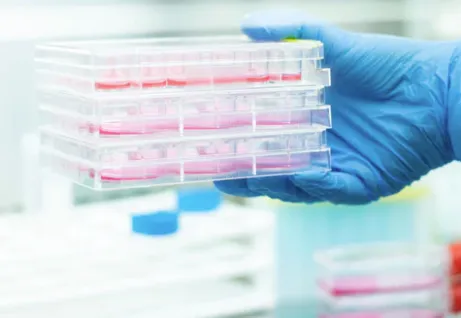
A small, faint colony is easy to judge differently from a large, well-defined one. Overlapping colonies create another decision, particularly when their boundaries are unclear. Even experienced scientists can disagree about what should count as a colony.
Our side-by-side comparisons of manual versus GelCount colony assay counting, alongside 20 years of user-generated data, have shown close agreement and improved consistency with GelCount. The user defines the detection criteria once and applies them across the experiment, then reviews the images to check what was included.
Adding treatments, doses or replicates means more wells to count. If analysis is already filling an afternoon, expanding the experiment can become difficult to justify.
Specific challenges of 3D culture
In soft agar and other 3D matrices, objects sit at different depths. Under a microscope, you need to track where you’ve been across the well both in the x/y axes and in the z-axis, without missing objects or counting them twice. Estimating whether each one meets a minimum size adds another judgment. [1]
A single, high-resolution image of the whole well is hugely beneficial. On-screen inspection of detected objects and the application of colony size thresholds across the experiment dramatically ease the workflow.
Our article on quantifying organoid size and counts explores these practical challenges in more detail.
Colony & spheroid counts, versus diameter distribution
The colony count is a direct measure of the ‘survived’ fraction of seeded cells. The object diameter parameter additionally provides a size distribution insight. Two wells may contain similar numbers of colonies or spheroids, but very different proportions of small and large objects, a nuance a simple object count would miss.
GelCount can report size distributions as well as mean diameter. That helps you spot changes in a subset of the population that an average could hide, without a separate round of manual measurements. [2]
The criteria still need to fit the biology. In a conventional clonogenic assay, a colony is commonly defined as containing at least 50 cells. An image-based size cut-off needs checking against that definition for your cell line; a diameter measurement is not a direct cell count. [3]
GelCount has an established track record across different cell types and culture formats. Published applications include counting MCF-7 breast cancer colonies [4], A549 lung cancer colonies [5], and PC3 and LNCaP prostate cancer colonies in soft agar [6]. In the prostate cancer study, researchers used analysis settings appropriate for each cell line. [6]
Once suitable criteria are established, automation applies them consistently. Review representative images across treatment groups before using the same protocol for the full experiment.
Detection settings can be saved as templates for later experiments. A new student or colleague can then start with the lab’s agreed and previously saved criteria, making it easier to maintain the same counting approach as people change. [2]
GelCount technical specifications
GelCount uses bottom-up, whole-well imaging to capture objects throughout the culture depth in a single view, within an effective depth of field of several millimetres. It is designed for mammalian colonies, spheroids and organoid cultures. [2]
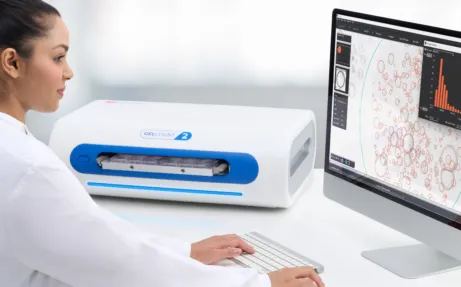
| Imaging resolution | User-selectable 300–2,400 dpi |
| Effective depth of field | Up to 5 mm above the well base |
| Batch capacity | Up to four multi-well plates |
| Typical acquisition time | Under 10 minutes for four 6-well plates at 1,200 dpi |
| Outputs | Counts and diameter statistics to Excel; raw and processed image exports; publication-ready images |
Acquisition time depends on the resolution and plasticware. Setup and review should be included when comparing the complete workflow with manual counting. The depth of field allows suitable 3D cultures to be imaged without z-stacking; there is no requirement for a reconstructed 3D image. [2]
Colony types and culture formats supported
GelCount accommodates 6-, 12-, 24-, 48- and 96-well plates, supported Petri dishes and Ibidi® 15-well 3D chamber slides. Applications include stained adherent colonies, non-adherent colonies in semi-solid media, spheroids and organoids. [2]
Many 3D cultures can also be imaged without staining. Where sample contrast is sufficient, this removes a preparation step and lets you count and size the objects without adding a detection dye. [2]
The sample’s appearance will influence detection. Dense spheroids and clear colony boundaries present different challenges from faint, thin-walled organoids or crowded cultures. Check representative samples, including difficult treatment groups, before settling on the analysis settings.
Reproducibility and reviewing your results
A permanent digital image record of samples is useful when a colleague questions a count, or a reviewer asks how colonies were selected. GelCount exports both raw and processed images, so you can show the original sample alongside the detected objects and make it clear what contributed to the count. Outputs also include publication-ready images and numerical results exported directly to Excel. [2]
Keep the analysis settings, sample identifiers and any manual corrections with the results. If you revise a threshold, document why and apply the change consistently across the experiment. Retain the raw images for reanalysis, too. You can then explain how the count was produced and return to the original image when needed.
Practical considerations for switching from manual counting
Start with an assay your lab already knows well. Include low and high counts, small and large colonies, and examples with debris or overlapping objects. Compare automated results obtained at one or two image resolution settings with carefully reviewed manual counts, investigate disagreements and agree on the settings to use before analyzing the full study.
For budgeting, measure the hands-on time you currently spend counting, sizing, recording and checking results. Compare that with the automated GelCount workflow against your weekly throughput. Shared use may also help; GelCount software can be installed on multiple workstations so multiple teams can continue their analysis away from the imager. [2]
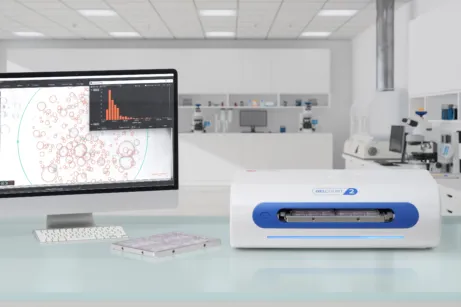
The core software has no annual subscription or additional licensing fees and within-version updates are free. Once images are saved, a colleague can use the instrument while you analyze your results independently. [7]
The benefits of GelCount become clear when the usually tedious and rate-limiting stage of counting colonies and spheroids no longer limits how many conditions your team can study.
Reach out to us to find out how GelCount can handle your assays. Tell us about your assays, the plasticware types you use, and your typical assay volumes.
References
1. Croft J, Oxford Optronix (2021). Quantifying Organoid Size and Counts: Solving a Common Issue using Automation
2. GelCount product page. Product features and technical specifications.
3. Franken NA, Rodermond HM, Stap J, Haveman J, & van Bree C (2006). Clonogenic assay of cells in vitro. Nature Protocols
4. Simsek D, Hassan GS, Sotgia F, & Lisanti MP. Investigating the Role of Peroxisomes in Regulating Breast Cancer Stem Cell Mechanisms. Int J Mol Sci
5. Stolz J, Rogal K, Bicher S, Winter J, Ahmed M, Raulefs S, et al (2025). The Combination of Temporal and Spatial Dose Fractionation in Microbeam Radiation Therapy. Biomedicines
6. Wu D, Lim WK, Chai X, Seshachalam VP, Rasheed SAK, Ghosh S, et al (2025). Gα13 Promotes Clonogenic Growth by Increasing Tolerance to Oxidative Metabolic Stress in Prostate Cancer Cells. Int J Mol Sci
7. Croft J, Oxford Optronix (2026). Subscription-free software, unlimited user installations